Free & Open — Windows · Linux  ·  V3.2.0

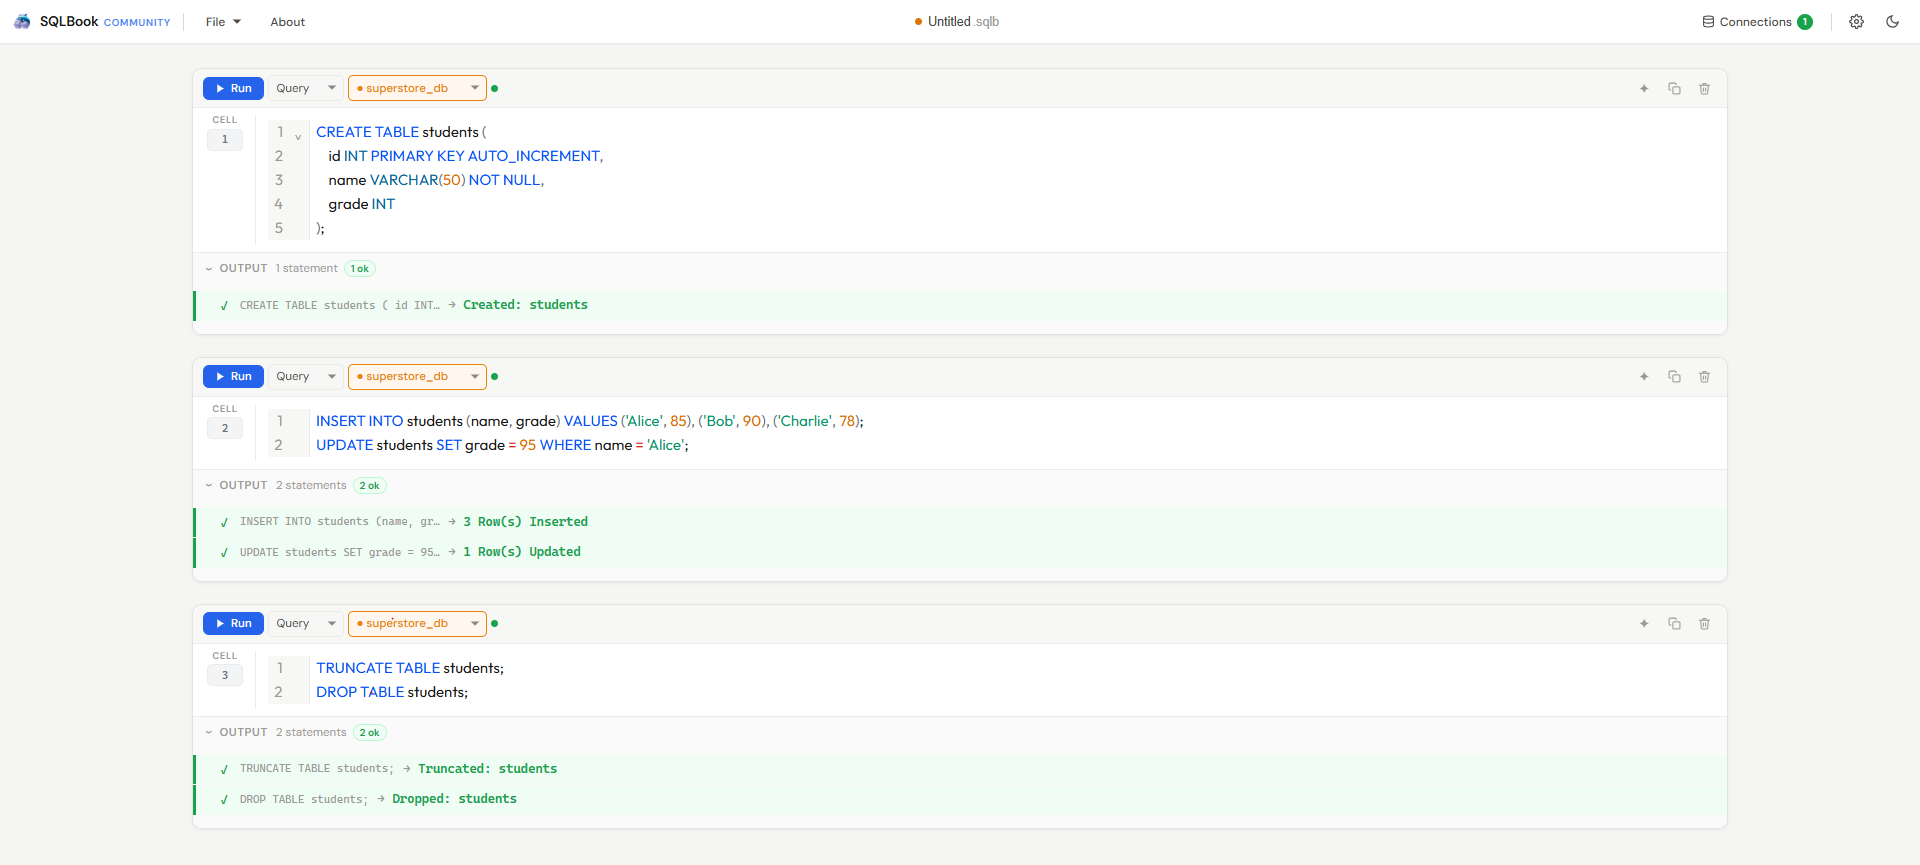
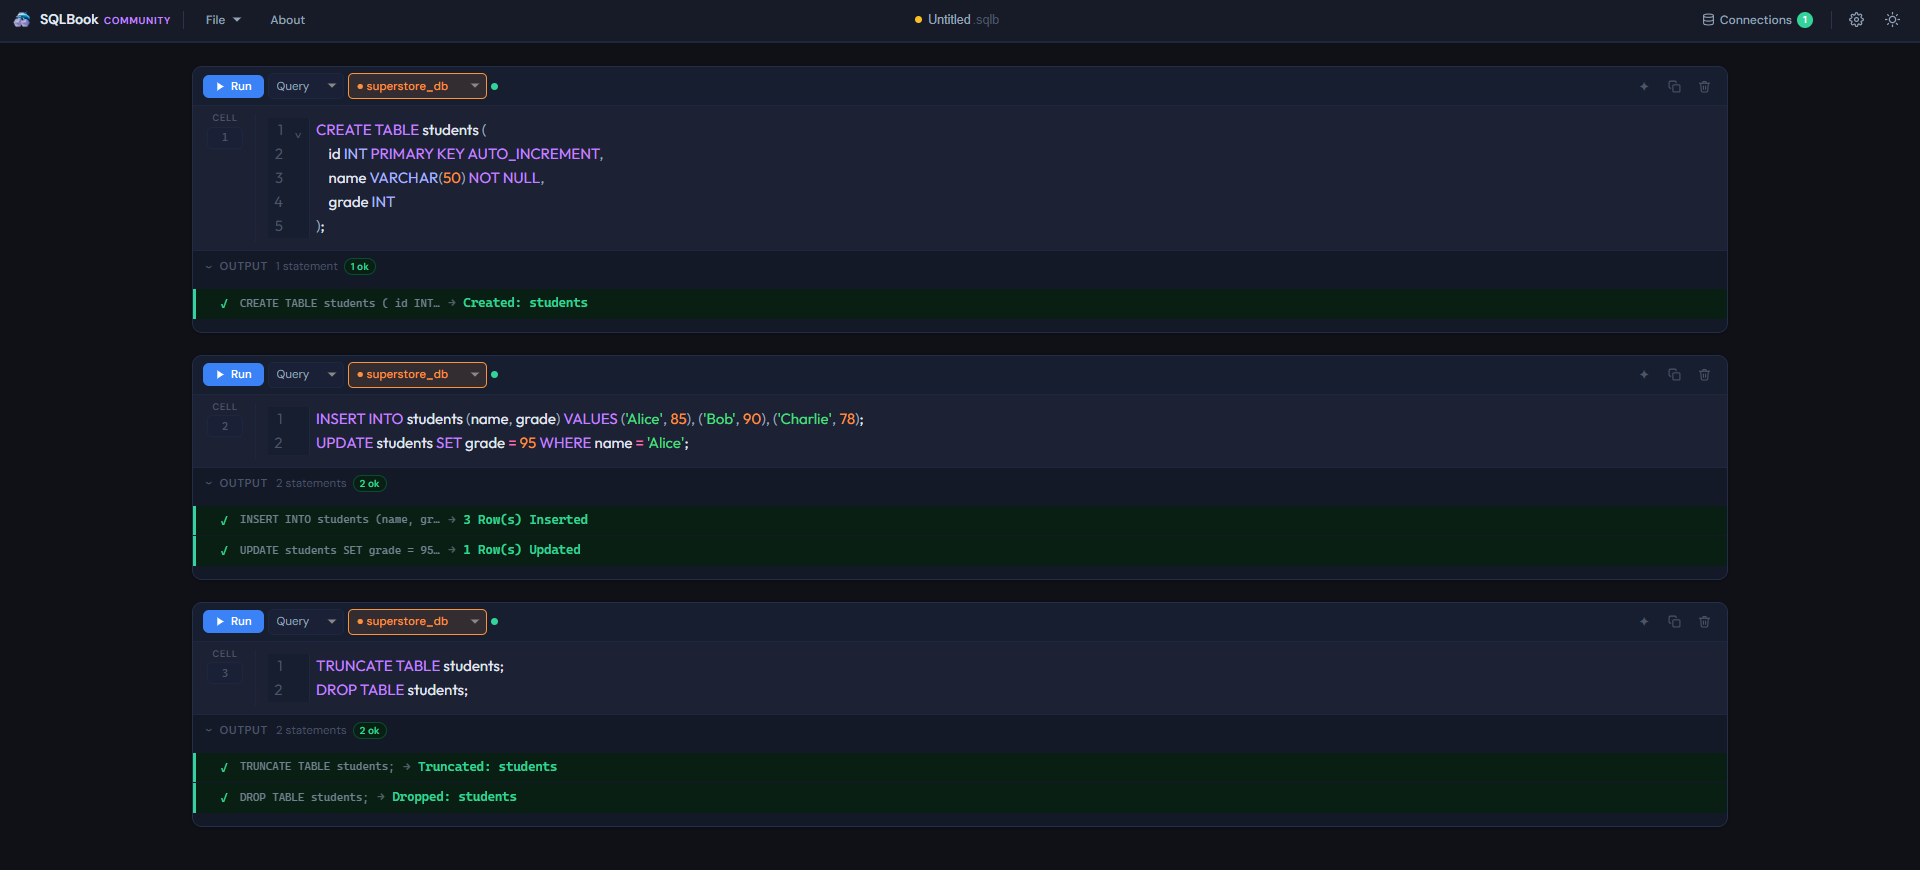
SQL is All You Need.
Write, Run & Visualize.

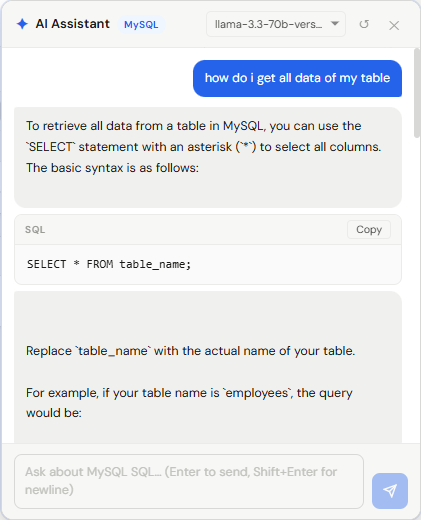
If you know SQL, you're already ready. Connect to MySQL, PostgreSQL, SQL Server or OracleDB, run your queries, and turn results into beautiful charts — bar, line, pie, scatter, heatmap and more. No Python. No programming. No cloud. Just SQL.

17Downloads
4Database Engines
100%Local & Private
0Supporters
← Hover To Preview →
SQLBook light theme
SQLBook dark theme

One tool. SQL in.
Insight out.

Multi-Database in One Notebook

Connect to MySQL, PostgreSQL, SQL Server and OracleDB simultaneously. Each cell can target a different connection — switch without leaving your workflow.

MySQL PostgreSQL SQL Server OracleDB
📓

Notebook-style Cells

Mix Query, Note, and Heading cells in one document. Organize complex analyses with human context right alongside the SQL.

📊

Charts Built Into the Notebook

Every query result has a Visualize button. Click it, pick a chart type, adjust axes — the chart saves with the notebook. No separate tool, no export step.

AI SQL Assistant

Use your own API keys — OpenAI, Anthropic, Groq, Google Gemini or a local offline model. The AI understands your database type and notebook context.

🔒

100% Local & Secure

Everything runs on your machine. Connection credentials and AI keys are encrypted and machine-bound. No telemetry, no cloud sync.

📁

.sqlb File Format

Notebooks save as .sqlb files — a clean JSON format that stores queries, results, charts, notes, and AI context all in one portable file.

Smart SQL Editor

Full syntax highlighting, dialect-aware keyword completion, smart indentation, Ctrl+D to duplicate lines, and per-database keyword sets.

🖨

Export & Print

Export result tables to CSV, copy as tab-separated, or print the whole notebook with a clean layout that fits properly on the page.

Not a BI tool. Not just a SQL client.
Something in between — and better.

Every existing option asks you to give something up. SQLBook doesn't.

🗄
SQL Clients
(DBeaver, DataGrip, TablePlus)
Great for querying. No notebook flow, no charts, no way to document your work alongside the SQL.
📊
BI Tools
(Tableau, Power BI, Metabase)
Excellent charts. Cloud-heavy, expensive, set up by admins. You're building dashboards, not writing free SQL.
THAT'S SQLBOOK
SQL Notebook — Local
Free · Private · Portable
Write SQL freely. Build charts. Add notes. Save everything — queries, results, charts — in one .sqlb file that never leaves your machine.

From install to insight
in under two minutes.

01

Install & Launch

Download for your platform, run it, and SQLBook opens. No account, no setup wizard, no telemetry.

02

Connect Your Database

Open the Connections panel, fill in host, port, and credentials. Test connection — done. Everything stays encrypted on your machine.

03

Write & Run SQL

Add a Query cell, select your connection, write SQL, press Shift+Enter. Results appear instantly with row counts and CSV export.

04

Chart It — Right There

Click Visualize on any result. Pick a chart type, adjust the axes, give it a name. The chart saves inside your .sqlb file alongside the query that produced it.

Your database,
your AI, your keys.

SQLBook's AI assistant uses your own API keys — OpenAI, Anthropic, Google Gemini, Groq, or a local model running entirely on your machine. No middleman, no markup, no data leaving your control.

  • ✦ Knows your database type and writes dialect-specific SQL
  • ✦ Remembers what you've discussed across the notebook session
  • ✦ Conversation context saved with the .sqlb file
  • ✦ Keys encrypted and stored locally — never sent to us
  • ✦ Works completely offline with local models

Query. Chart. Save.
All in one place.

Most SQL tools show you a table and leave you to figure out the rest. In SQLBook, every result has a Visualize button. The chart lives next to the query that created it, saved together in your .sqlb file — so when you reopen it a month later, everything is exactly as you left it.

Widget Pro
Gadget X
Tool Suite
Cloud Kit

Bar & Column Charts

Compare values across categories. Perfect for sales data, performance metrics, or any ranked comparison.

Line & Area Charts

Track trends over time. Works beautifully with time-series data, KPIs, and anything date-based.

Pie & Donut Charts

Show proportions and distributions. Auto-detects category columns and renders instantly.

Scatter & Bubble Charts

Explore correlations between two numeric columns. Great for spotting outliers or clusters in your data.

Radar Charts

Compare multiple attributes across categories. Works well with performance data or multi-dimensional comparisons.

Box Plot & Candlestick

Visualize statistical distributions and financial OHLC data. Perfect for price analysis, data spread, and outlier detection.

Network Chart

Map relationships between entities — foreign keys, user connections, data pipelines. Great for visualizing linked data structures.

Sales Cost Margin Units

Parallel Coordinates

Compare multiple numeric dimensions simultaneously. Ideal for spotting patterns across many columns in one view.

Waterfall Chart

Show cumulative effect of sequential values — running totals, financial statements, budget variances at a glance.

68%

Gauge Chart

Display a single KPI as a speedometer-style dial. Perfect for dashboards showing progress, utilization, or score.

Visits 10,000 Leads 4,200 Trials 1,800 Paid 640

Funnel Chart

Track drop-off through conversion stages — sales pipelines, signup flows, or any sequential process with reducing counts.

Category A Cat B C Category D

Treemap

Show hierarchical data as nested rectangles sized by value. Great for budget breakdowns, disk usage, or category proportions.

MonTueWedThuFriSatSunQ1Q2Q3Q4

Heatmap

Visualize density and intensity across two dimensions — time patterns, correlation matrices, or activity grids.

🎯

Smart Auto-Detect

SQLBook reads your column types and automatically picks the most appropriate chart. Date columns become line charts. Categories become bars. You can always switch — no config files, no extra steps.

  • ✓ Chart lives next to the query that made it
  • ✓ Config saved in .sqlb — reopens as you left it
  • ✓ Customise axes, colors, labels freely
  • ✓ Export chart as PNG image
  • ✓ Works on any SELECT result table

Free for the Community.

Community
Free forever
  • ✓ All 4 database engines
  • ✓ Unlimited notebooks & cells
  • ✓ Built-in data visualizations
  • ✓ AI assistant (your API key)
  • ✓ CSV export, print, .sqlb format
  • ✓ 100% local — no cloud
Download Now
Supporter
Any Amount
  • ✓ Everything in Community
  • ✓ Extra supporter perks in next versions
  • ✓ Name in the supporters list
  • ✓ A Happy Developer
Become a Supporter
📖 User Guide

New to SQLBook? Start here.

Our complete guide walks you through everything — setting up connections, writing queries, building charts, using the AI assistant, and more.

Read the SQLBook Guide →
Connections · Cells · Charts · AI Assistant · Transaction Mode · .sqlb Files

Get SQLBook Free

Enter your details — we'll send a verification code, then your download starts immediately.

Latest version: V3.2.0

Your Details

We keep this for our records only. No spam, ever.

By continuing you agree to our Privacy Policy. We use your email only for verification and your details only for usage analytics.

🔒 Email used only for verification · ⚡ Free forever · 🖥 Windows · Linux · Privacy Policy